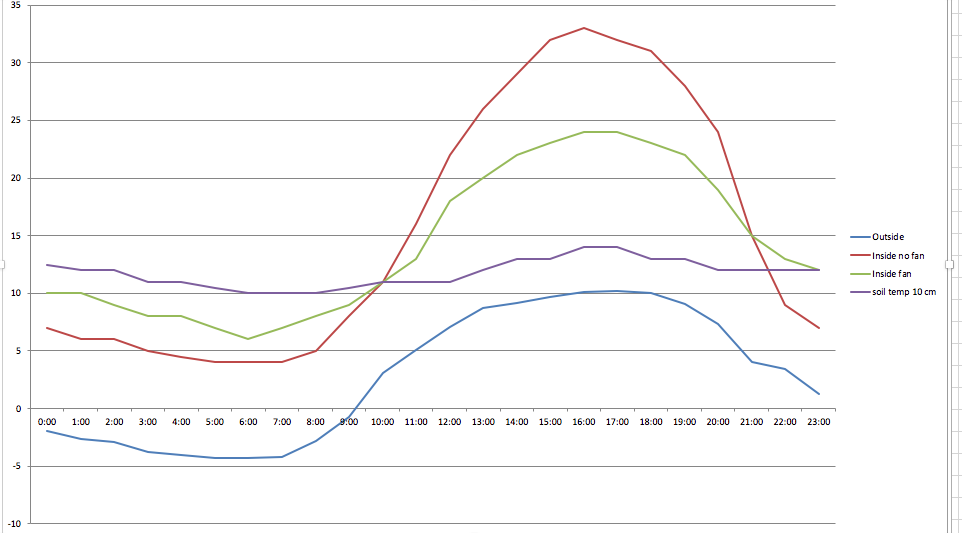
The graph to the above shows three different daily plots for data loggers that have been installed in a greenhouse in mid-April. The four graphs show temperatures in the air in the greenhouse, in the soils in the greenhouse and outside the greenhouse. These graphs were taken before and after thermal regulation actions were taken.